



Every marketing department keeps a graveyard. Ours is a supply closet: a milk crate of tangled lanyards, a shrink-wrapped brick of stress balls, and something like four hundred stylus pens from a trade show nobody can name anymore. None of it was a bad purchase on paper. The unit costs were sane, the logo reproduced cleanly, the invoice cleared. The problem was subtler and far more expensive than a bad price. Nobody actually wanted the stuff.
The Advertising Specialty Institute put that exact question to thousands of American consumers for its 2026/2027 Global Advertising Impressions Study, and the phrasing matters. Respondents weren’t asked what they’d tolerate, or what seemed useful, or what they’d begrudgingly stuff into a tote on the way out of a conference hall. They were asked which promotional products they’d be most excited to receive. Enthusiasm, not tolerance. It’s a low bar that a surprising amount of corporate merchandise fails to clear.
Here’s the full ranking, and then the part that actually matters: what to do about it when you’re the one signing off on five thousand units.
The short answer
American consumers are most excited to receive T-shirts (55%), fleece and jackets (52%), and food gifts (51%). Those three are the only categories to clear the halfway mark. Blankets (44%), bags (41%) and drinkware (41%) round out the upper tier. At the opposite end, buttons, lanyards and stickers manage just 11%, making them the least-wanted promotional product in the United States by a wide margin.
Promo products Americans want most, ranked
| Rank | Product category | % excited to receive |
|---|---|---|
| 1 | T-shirts | 55% |
| 2 | Fleece & jackets | 52% |
| 3 | Food gifts | 51% |
| 4 | Blankets | 44% |
| 5 | Bags | 41% |
| 5 | Drinkware | 41% |
| 7 | Caps & hats | 38% |
| 8 | Writing instruments | 36% |
| 9 | Notebooks & notepads | 35% |
| 10 | Mobile power banks | 34% |
| 10 | Polos | 34% |
| 12 | Housewares & tools | 33% |
| 13 | Health & safety | 32% |
| 13 | Umbrellas | 32% |
| 15 | USB drives | 28% |
| 16 | Calendars | 27% |
| 17 | Desk & office accessories | 26% |
| 18 | Magnets | 20% |
| 19 | Buttons, lanyards & stickers | 11% |
The podium: soft goods and things you can eat
Notice what the top three have in common. They’re all things a person would plausibly acquire for themselves. Nobody walks into a store to buy a lanyard. Plenty of people buy T-shirts, jackets and good chocolate.
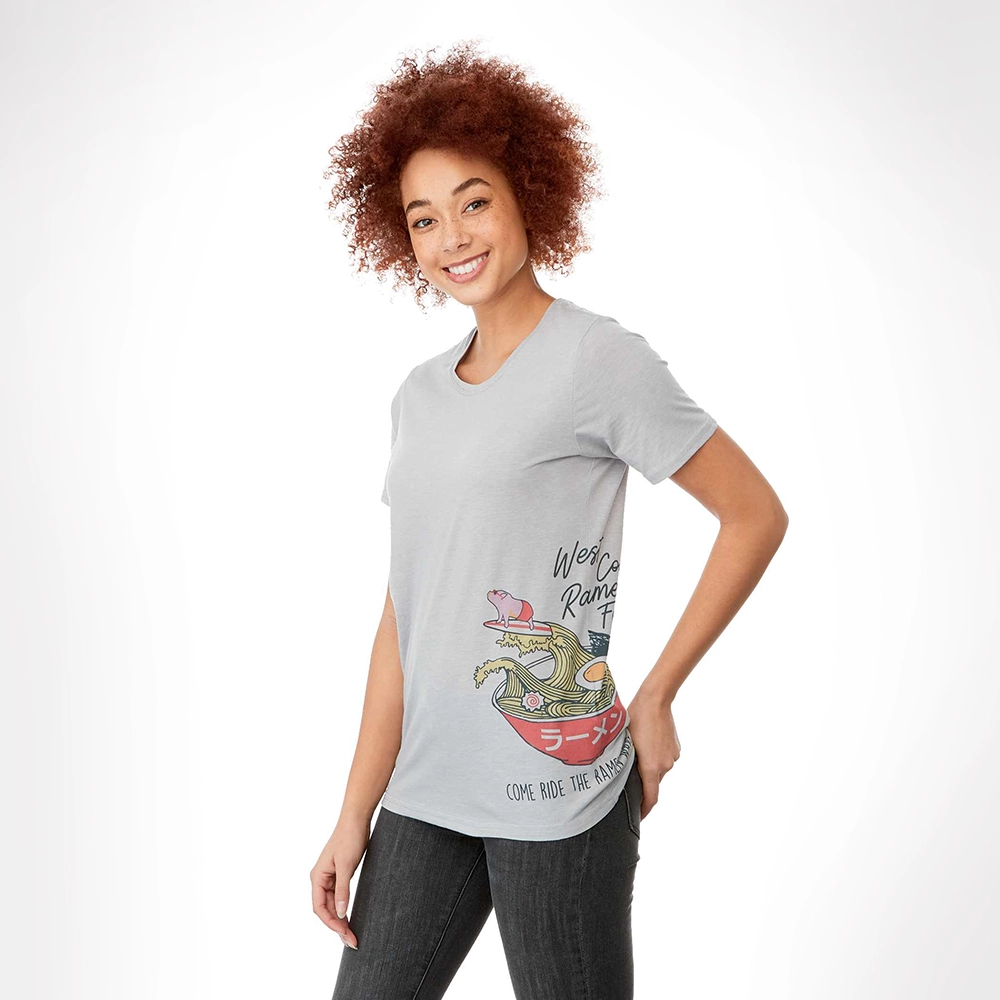
T-shirts take the crown at 55%, which is both entirely predictable and slightly treacherous. A tee is the most democratic garment on earth. It costs little, decorates beautifully, and fits into any budget line. But the appetite is for a shirt someone would actually wear, not a boxy 50/50 blend in a color that exists nowhere in nature. Fit, fabric weight and colorway do more heavy lifting here than the artwork does. Get those right and you’ve bought roughly 3,500 impressions per shirt. Get them wrong and you’ve bought a rag for washing a car.
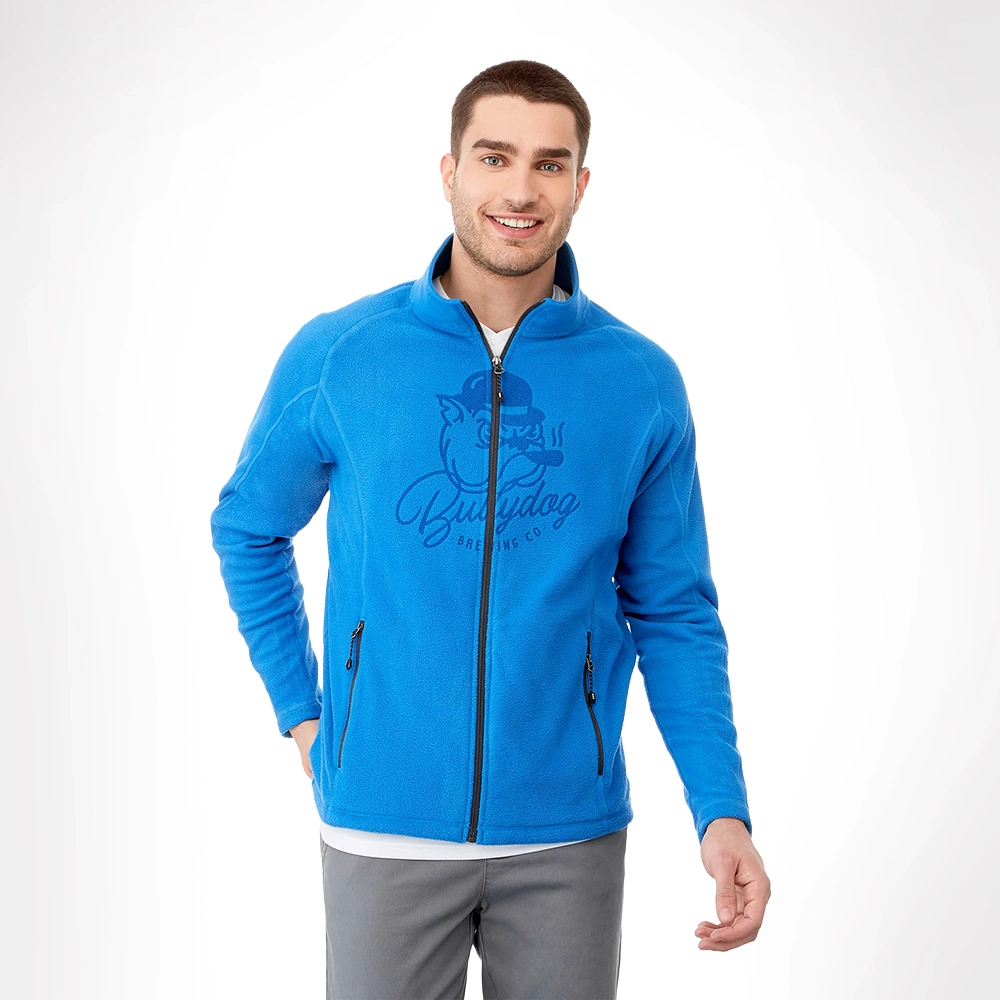
Fleece and jackets land at 52%, and this is the sleeper of the entire dataset. Outerwear isn’t merely wanted, it’s the single most visible category in the study, generating 9,000 impressions over its lifetime, more than any other promotional product. It’s the rare item that scores near the top on desire and exposure simultaneously. Yes, the unit cost makes procurement flinch. It shouldn’t: we ran the arithmetic in our breakdown of promo products with the best ROI, and outerwear’s cost-per-impression is a rounding error. If you’re building a branded apparel program and you can only fund one tier properly, fund this one.
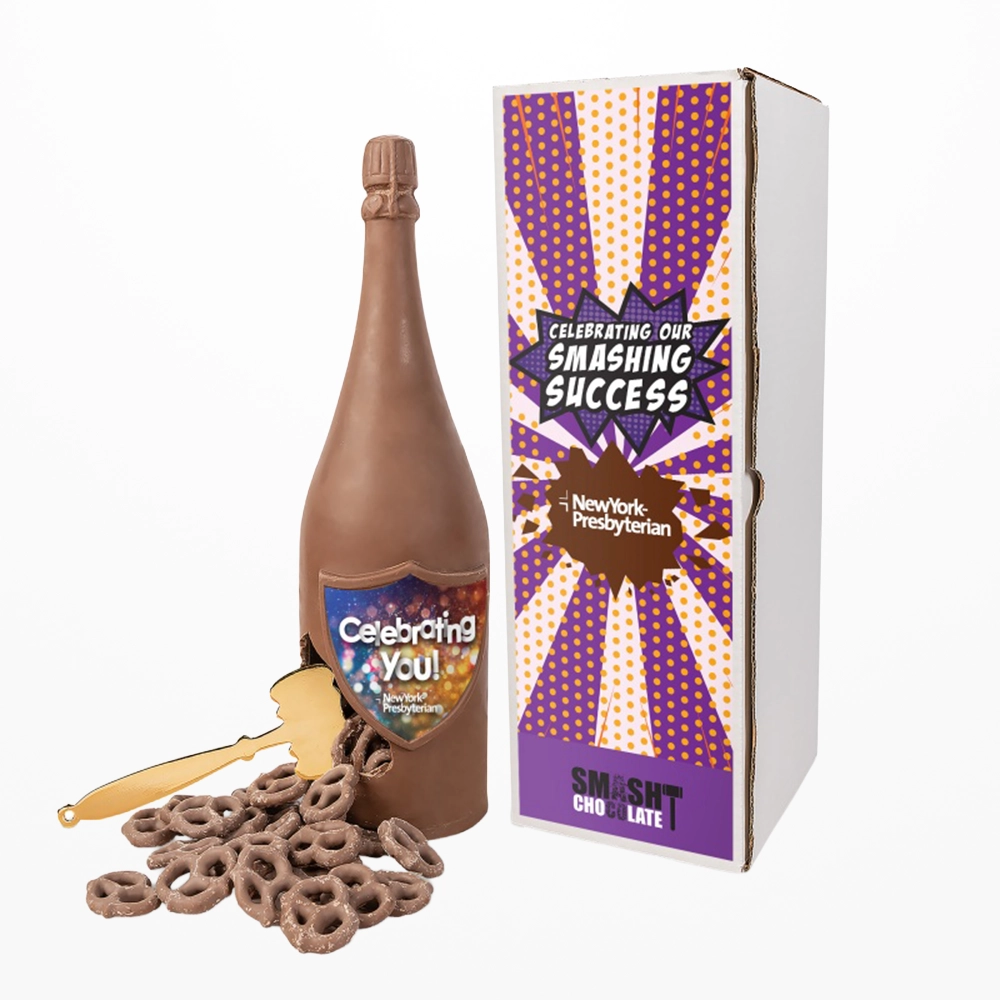
Food gifts sit at 51%, and they behave unlike anything else in the catalog. They generate almost no long-tail visibility, since they get eaten, yet they produce the warmest reception of any category in the study. We’ll come back to that apparent contradiction shortly, because it’s the most useful thing in this report.
The middle is where most budgets actually live
Between 30% and 45% you’ll find the workhorses: the categories that quietly consume the majority of American promotional spend, and mostly deserve to.
- Blankets (44%) punch far above their reputation. They’re the highest-scoring item that most buyers never seriously consider, and they read as generous in a way a $4 tumbler simply can’t.
- Bags (41%) pair strong appetite with 4,900 lifetime impressions, the second-most visible category going. A well-made cotton tote has quietly become a status object. A flimsy non-woven convention sack has not. The gap between those two experiences is about three dollars.
- Drinkware (41%) remains the most reliable mid-tier bet in the business, largely because a good insulated bottle earns permanent desk residency.
- Headwear (38%) deliver 4,000 impressions and, unlike most apparel, sidestep the sizing nightmare entirely.
- Writing instruments (36%) and notebooks (35%) are the unglamorous backbone. Nobody photographs them for LinkedIn. Everybody uses them.
- Power banks (34%) hold their ground even as phone batteries improve, because a dying handset at an airport gate is a permanent feature of modern life.
The basement, and why you should read it carefully
Buttons, lanyards and stickers at 11%. Magnets at 20%. Desk and office accessories at 26%. Calendars at 27%.
The tempting conclusion is to torch the bottom of the list. Resist it. Low excitement is not the same as low value, and conflating the two will cost you.
Desk accessories inspire enthusiasm in barely a quarter of consumers. Yet 83% say they’d be more likely to do business with the company that gave them one.
That single comparison should reframe how you read the whole table. Excitement measures the moment of receipt. It says nothing about what happens over the following eighteen months, while that desk organizer sits in a colleague’s eyeline through every meeting they host.
Lanyards are the clearest case. They finish dead last on desire, and you should still order them for your next conference, because a lanyard isn’t a gift. It’s infrastructure. Attendees need a credential holder. Nobody is thrilled to receive one, and nobody resents it either. Budget for those items as operational spend rather than gifting, and you’ll stop measuring them against the wrong benchmark. The same logic applies to a good deal of what goes into a trade show program.
What separates a want from a keep
Wanting an item is only the entry fee. Retention is where the impressions accumulate, and the study is refreshingly blunt about what drives it: 78% of U.S. consumers keep a promotional product because it’s useful to have. Enjoyment trails at 43%, attractiveness at 42%, and the item’s value as a reference for contact details limps in at 19%.
Read that last figure twice if you’ve ever asked a supplier to fit a phone number, a web address and a QR code onto a pen barrel. Almost nobody keeps your merchandise as a contact card. They keep it because it works.
The purchase-influence data points the same direction. Asked what would make them want a promotional item, consumers named quality (55%) and design (50%) ahead of everything else, including whether they liked the company (42%) or recognized the brand name (30%). Provenance carries real weight too: 41% cited domestic manufacturing, and 79% say a Made-in-the-USA promotional item improves their view of the advertiser outright.
Which yields an uncomfortable but liberating rule of thumb: fewer, better units beat more, cheaper ones. Two thousand jackets people wear will outperform ten thousand pens people bin, on every metric the study tracks.
The catch: wanted isn’t the same as effective
Now the twist, and it’s a big one. ASI asked a second question. How likely would you be to do business with an advertiser who gave you this? The rankings don’t match.
T-shirts, the most-wanted item in America, finish near the bottom for purchase intent at 69%. Food gifts, third on desire, top that chart at 92%. No category scores higher. Blankets leap from fourth to second. Desk accessories vault from seventeenth into a tie for third.
In other words, the merchandise people are gladdest to receive is not reliably the merchandise that moves them toward your invoice. Selecting purely on the excitement ranking will win you goodwill and lose you conversions. We’re unpacking that divergence properly in a follow-up, alongside our earlier analysis of the top branded items by real-world impressions. Between desire, visibility and purchase intent, only one category ranks near the top of all three. (It’s outerwear. It was always going to be outerwear.)
How to use this when you’re actually placing the order
- Split the budget by job, not by unit price. Gifting spend and operational spend are different disciplines. Judge lanyards and badge holders on whether the event ran smoothly. Judge jackets and food gifts on relationship outcomes.
- Spend up on the tier that reaches your best accounts. A hundred people who genuinely matter to your pipeline should receive something from the top of the table. Everyone else can receive something sensible.
- Interrogate quality before you interrogate quantity. Fifty-five percent of consumers said quality determines whether they’d want the item at all. Request samples. Handle the fabric. Weigh the tumbler.
- Flag domestic production wherever you can get it. It buys a measurable lift in brand perception, and it’s a line worth putting on the insert card.
- Run the numbers before you commit. Our promo products ROI calculator will tell you what a category costs per impression at your order volume.
Frequently asked questions
T-shirts, named by 55% of U.S. consumers as a product they’d be most excited to receive, followed by fleece and jackets at 52% and food gifts at 51%.
Buttons, lanyards and stickers, at 11%. Magnets follow at 20%. Both remain useful for practical event purposes, but neither functions well as a gift.
Overwhelmingly because they’re useful: 78% of U.S. consumers give that reason. Enjoyment (43%) and attractiveness (42%) matter considerably less, and only 19% keep an item to reference the advertiser’s contact information.
Not necessarily. T-shirts rank first on desire but near the bottom on purchase intent (69%), while food gifts rank third on desire and first on purchase intent (92%). Desire, visibility and business impact are three separate measurements.
All consumer figures cited above are drawn from the 2026/2027 Global Advertising Impressions Study. Research provided by the Advertising Specialty Institute, ©2026, All Rights Reserved.
Weighing up a program for the year ahead? Our team will happily talk through what belongs at each budget tier. Get in touch, or browse the full promotional products range.

